
1Machine Learning Fundamentals
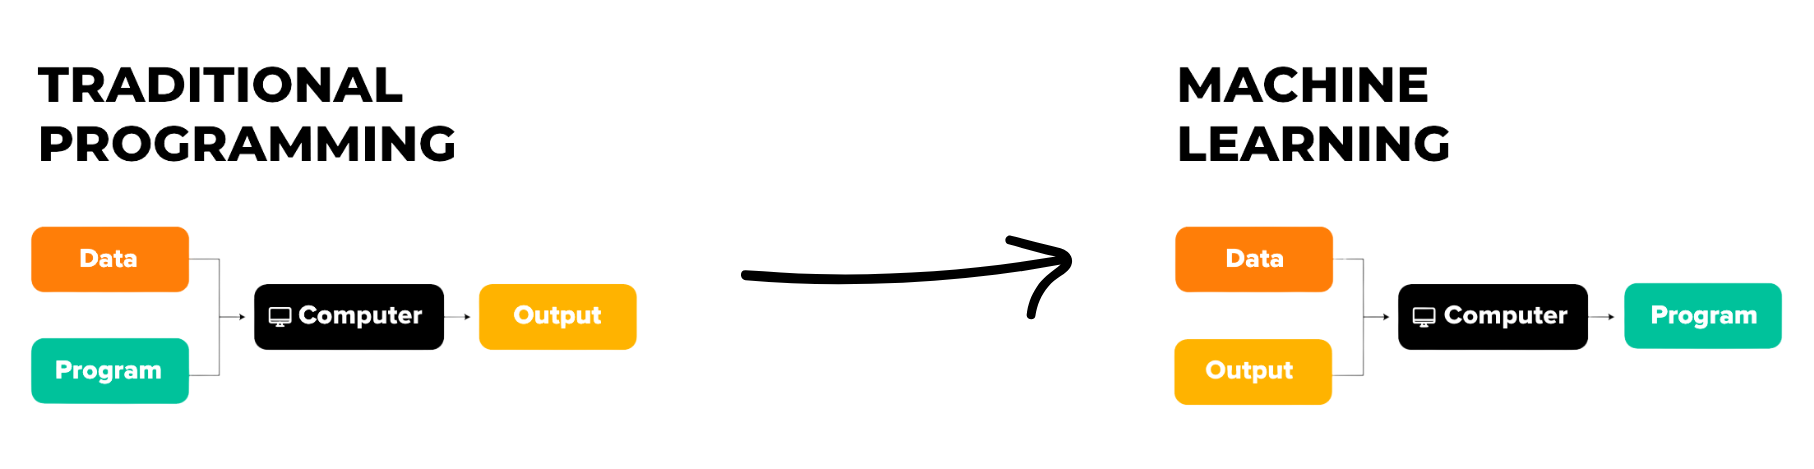
Machine Learning is the study of systems that improve through experience and data. The central difference from traditional programming is that, instead of explicitly writing every rule that transforms inputs into outputs, we provide examples so the system can learn useful relationships and later make predictions or decisions.
1.1The Three Main Learning Families
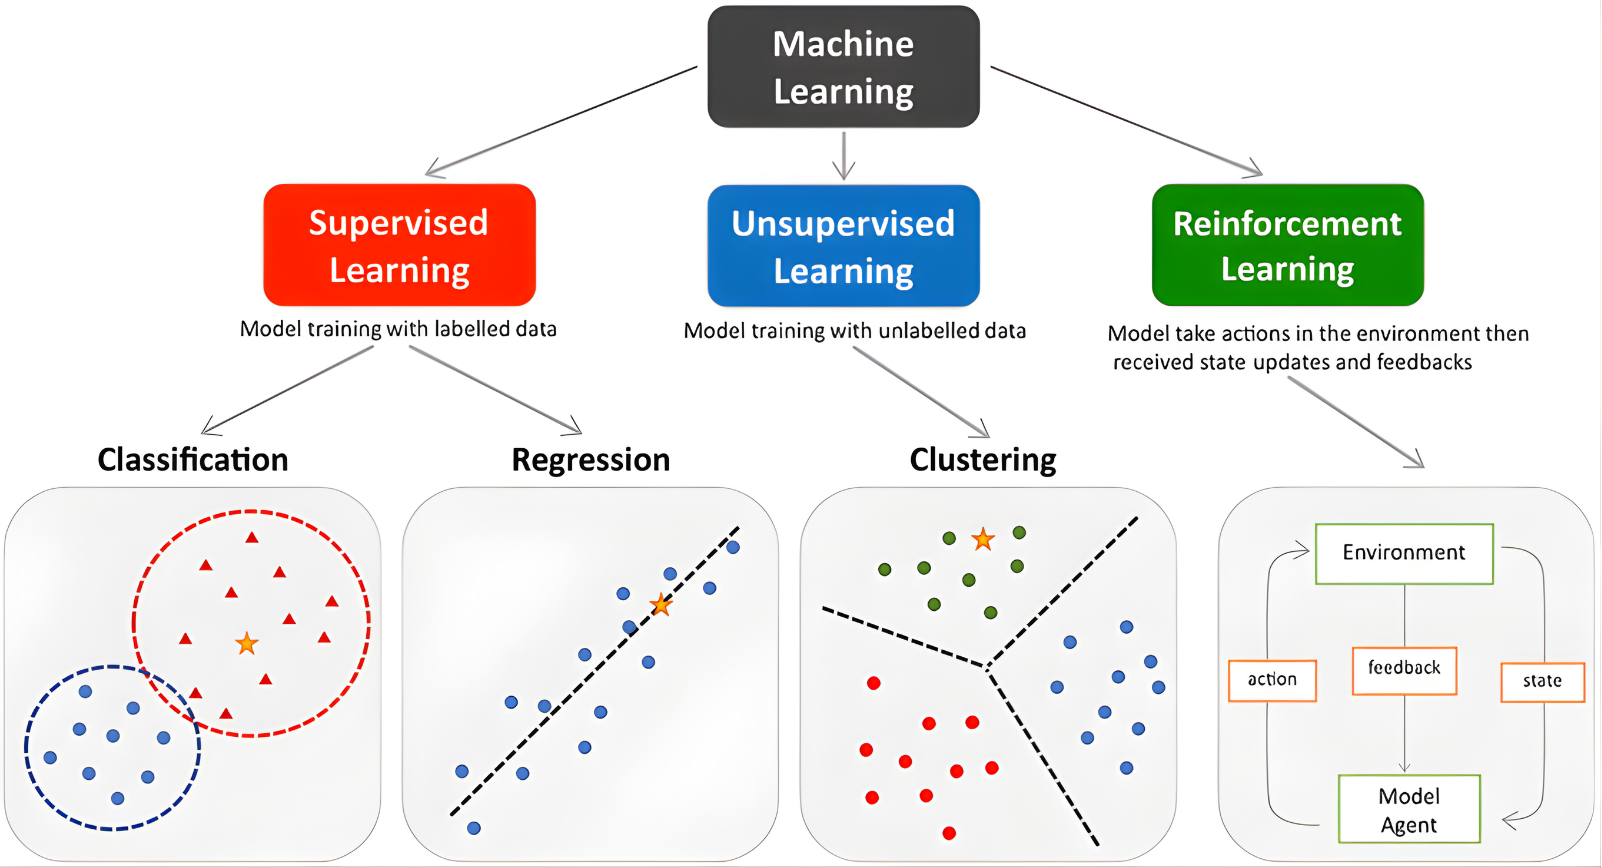
The introduction distinguishes three major families: supervised learning, unsupervised learning, and reinforcement learning. This classification provides a general map for understanding how different Machine Learning tasks are organized.
- Supervised learning: the system learns from data paired with an expected answer. Typical tasks include classification and regression.
- Unsupervised learning: the data has no target label; the goal is to discover structure such as groups, patterns, or lower-dimensional representations.
- Reinforcement learning: an agent acts in an environment, receives feedback, and adjusts its behavior through repeated interactions.
1.2How to Read the Rest of This Fundamentals Chapter
Before studying individual algorithms, this chapter focuses on the concepts shared by nearly every Machine Learning workflow: data, learning signals, validation, optimization, generalization, evaluation, reproducibility, and monitoring.
1.3The Machine Learning Project Lifecycle
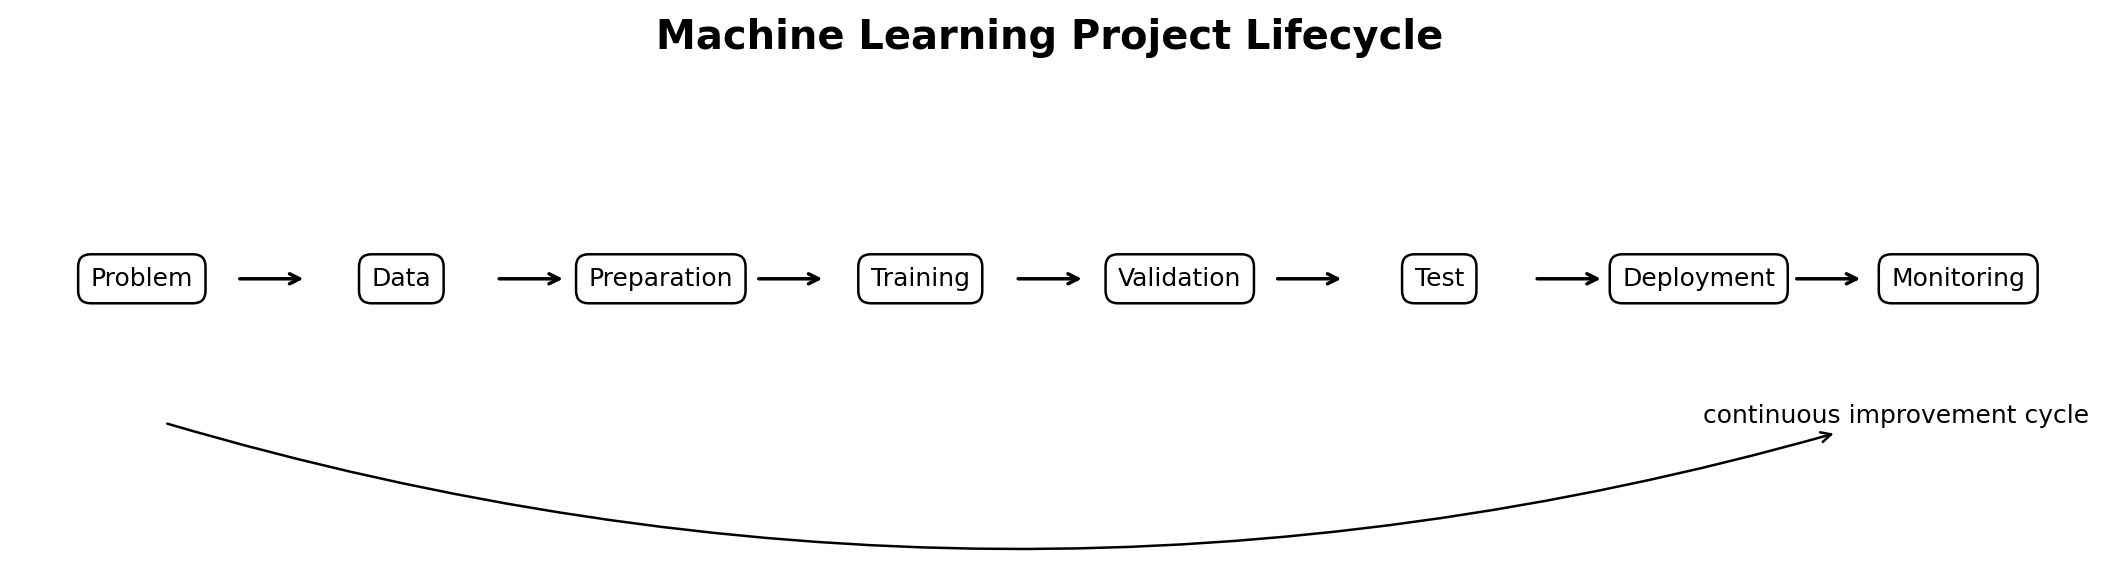
Before discussing algorithms, it is important to understand that a Machine Learning project is a complete, iterative process. The work starts with problem formulation and continues well beyond training. Every stage can affect the final quality of the system.
- Problem definition: specify the objective, expected output, constraints, and cost of errors.
- Data collection: gather sufficiently relevant and representative examples.
- Exploration: understand distributions, missing values, anomalies, duplicates, and imbalance.
- Preparation: clean, transform, and organize variables without introducing information leakage.
- Training: learn internal parameters from the training data.
- Validation: compare choices and tune hyperparameters.
- Testing: produce a final estimate on genuinely unseen data.
- Deployment and monitoring: track performance and respond when data changes.
1.4Data: Observations, Features, and Target
A dataset can be viewed as a collection of observations. Each observation is described by several features. In supervised learning, a target represents the answer the system is expected to learn to predict.
| Concept | Explanation |
|---|---|
| Observation | An individual example: a customer, transaction, image, measurement, etc. |
| Feature | Information describing the observation: age, amount, area, frequency, category, etc. |
| Target | The expected answer in supervised learning. |
| Dataset | The collection of observations used for analysis and learning. |
| Dimension | The number of features used to represent an observation. |
1.5Data Quality and Representativeness
A Machine Learning system learns from what the data shows it. If the data contains systematic errors, missing groups, or incorrect labels, the learning process can reproduce those problems. Data preparation is therefore a fundamental part of the workflow.
- Completeness: measure and understand missing values.
- Consistency: detect incompatible formats, contradictions, and duplicates.
- Accuracy: verify that values correctly describe reality.
- Representativeness: cover situations that will occur after deployment.
- Freshness: avoid outdated data when the underlying phenomenon changes.
- Label quality: verify the consistency of expected answers in supervised tasks.
1.6Training, Validation, and Test
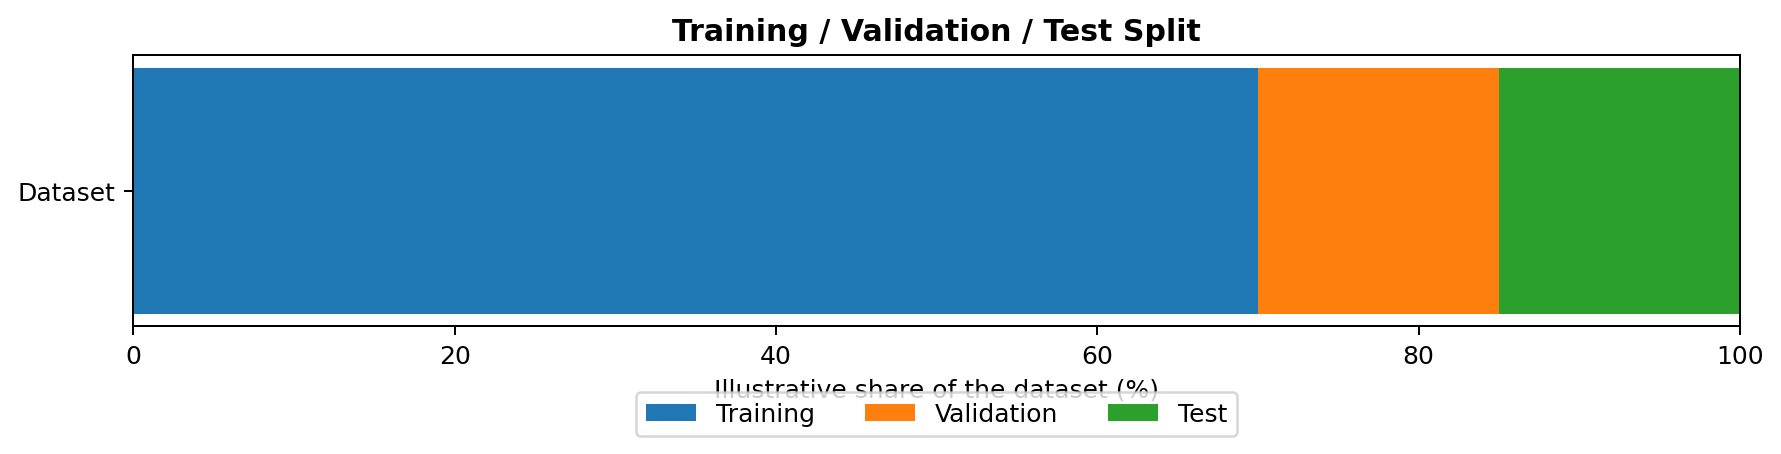
To measure generalization honestly, data is split into sets with different roles. Training data is used to learn parameters, validation data is used to make development decisions, and test data is kept isolated until final evaluation.
When data is limited, cross-validation can be used: several splits are evaluated successively to obtain a more robust performance estimate and reduce dependence on one particular split.
1.7Parameters and Hyperparameters
Parameters and hyperparameters play different roles. Parameters are learned automatically from data during training, while hyperparameters control how learning behaves and are selected by the practitioner or a tuning procedure.
| Element | Parameters | Hyperparameters |
|---|---|---|
| Origin | Learned during training | Chosen before/around training |
| Role | Represent what the system has learned | Control capacity, regularization, or the learning process |
| Tuning | Automatic optimization | Validation, grid search, random search, etc. |
1.8Loss Functions and Optimization
To learn, the system needs a numerical signal indicating whether its predictions are good or bad. A loss function measures prediction error, and optimization changes the learned parameters to reduce that loss over repeated iterations.
- Prediction: output produced by the system.
- Error: difference between the prediction and the expected result.
- Loss function: mathematical rule used to quantify that error.
- Optimization: procedure that adjusts parameters to reduce loss.
- Convergence: the point at which improvements become small or stabilize.
Low training loss alone is not sufficient evidence of quality. Performance must remain strong on data that was not used for learning.
1.9Generalization, Underfitting, and Overfitting
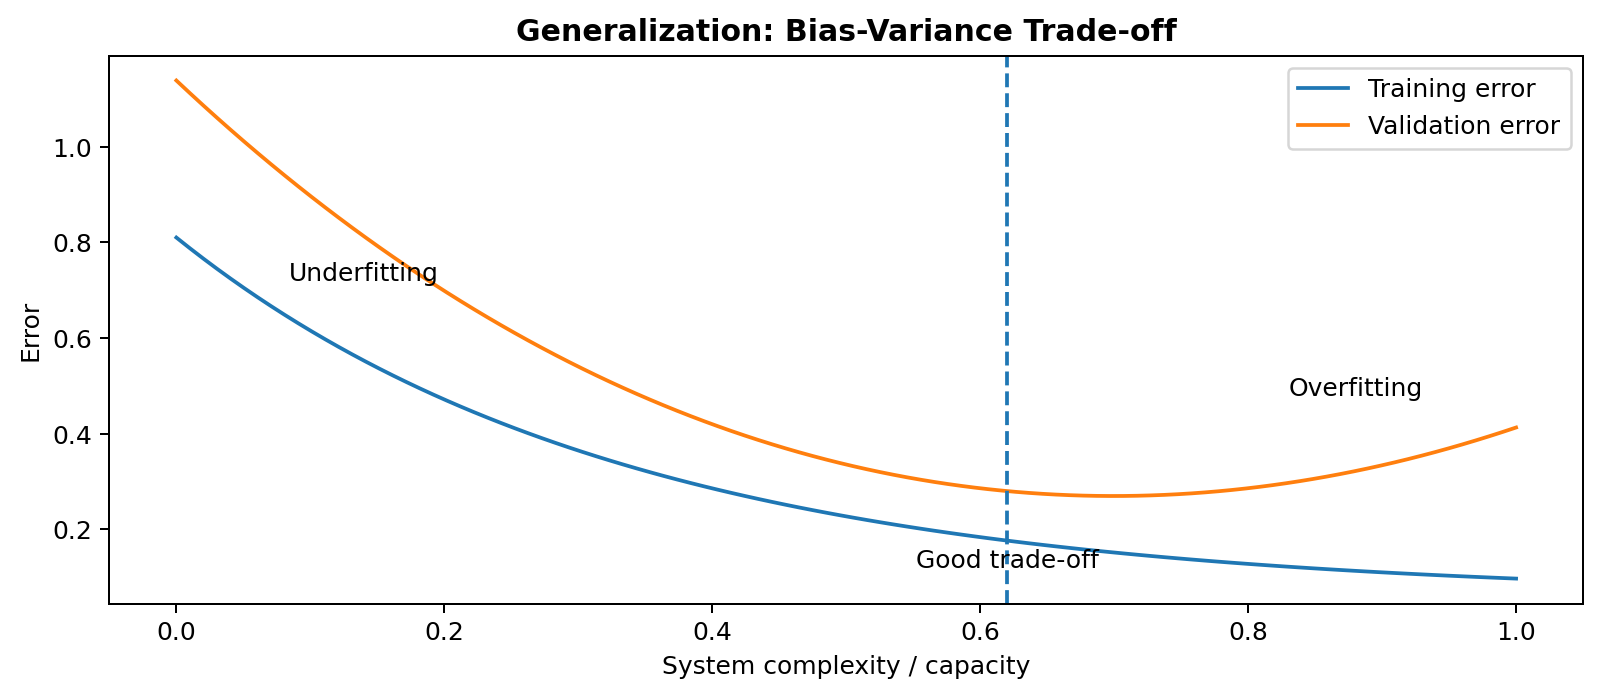
Generalization is the ability to perform well on new data. Underfitting occurs when the system is too simple to capture the useful structure; overfitting occurs when it adapts too closely to training examples and their noise.
- Underfitting: the system is too simple or insufficiently trained and already makes many errors on the training data.
- Overfitting: the system adapts too closely to the training data, including its noise, and loses performance on new data.
- Good trade-off: the system learns enough of the useful signal without capturing accidental details of the training set.
1.10The Bias-Variance Trade-off
Bias reflects systematic error caused by an overly simple representation of the problem. Variance reflects excessive sensitivity to the specific training sample. Good generalization requires a useful balance between the two.
- High bias → tendency toward underfitting.
- High variance → tendency toward overfitting.
- The objective is not only to minimize training error, but to minimize error on new data.
1.11Measuring Performance
A metric summarizes prediction quality. The correct metric depends on the task and on the real cost of different errors. Looking at several complementary metrics is often more informative than relying on a single score.
| Task type | Common metrics | General interpretation |
|---|---|---|
| Classification | Accuracy, Precision, Recall, F1-score | Measure different aspects of predicted-class quality. |
| Regression | MAE, MSE, RMSE, R² | Measure the gap between predicted and actual values. |
1.12The Confusion Matrix
For binary classification, a confusion matrix shows the nature of errors rather than only their total number. It separates true positives, true negatives, false positives, and false negatives.
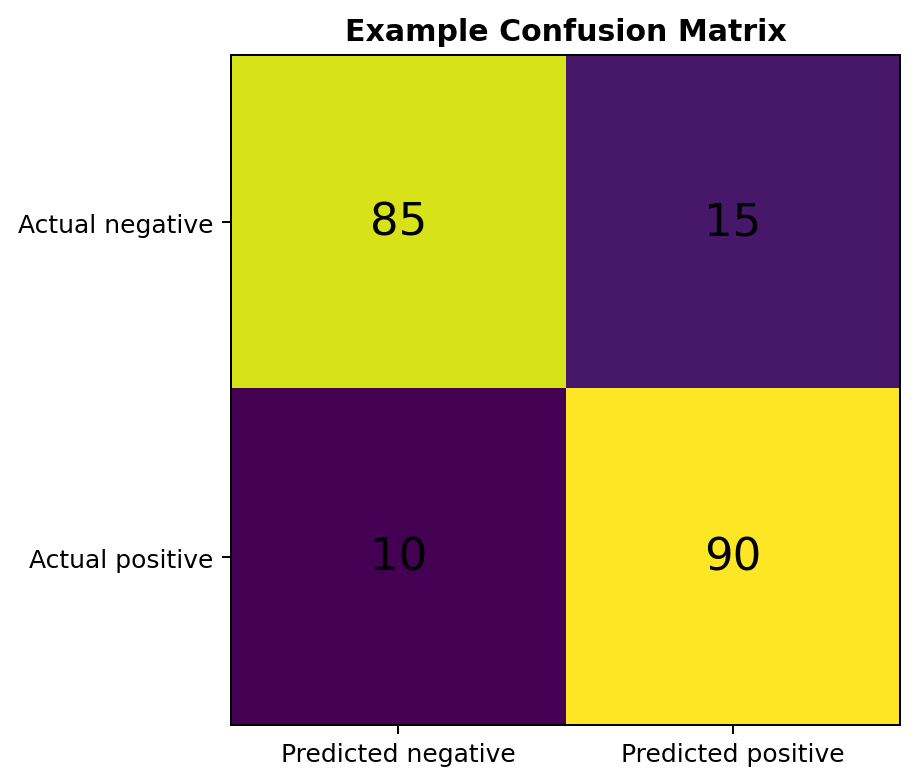
- True positive: a positive case is correctly detected.
- True negative: a negative case is correctly rejected.
- False positive: the system predicts positive when the case is actually negative.
- False negative: the system misses a truly positive case.
1.13Data Leakage
Data leakage occurs when information that should not be available at prediction time influences training or validation. It can create unrealistically strong development results that fail in production.
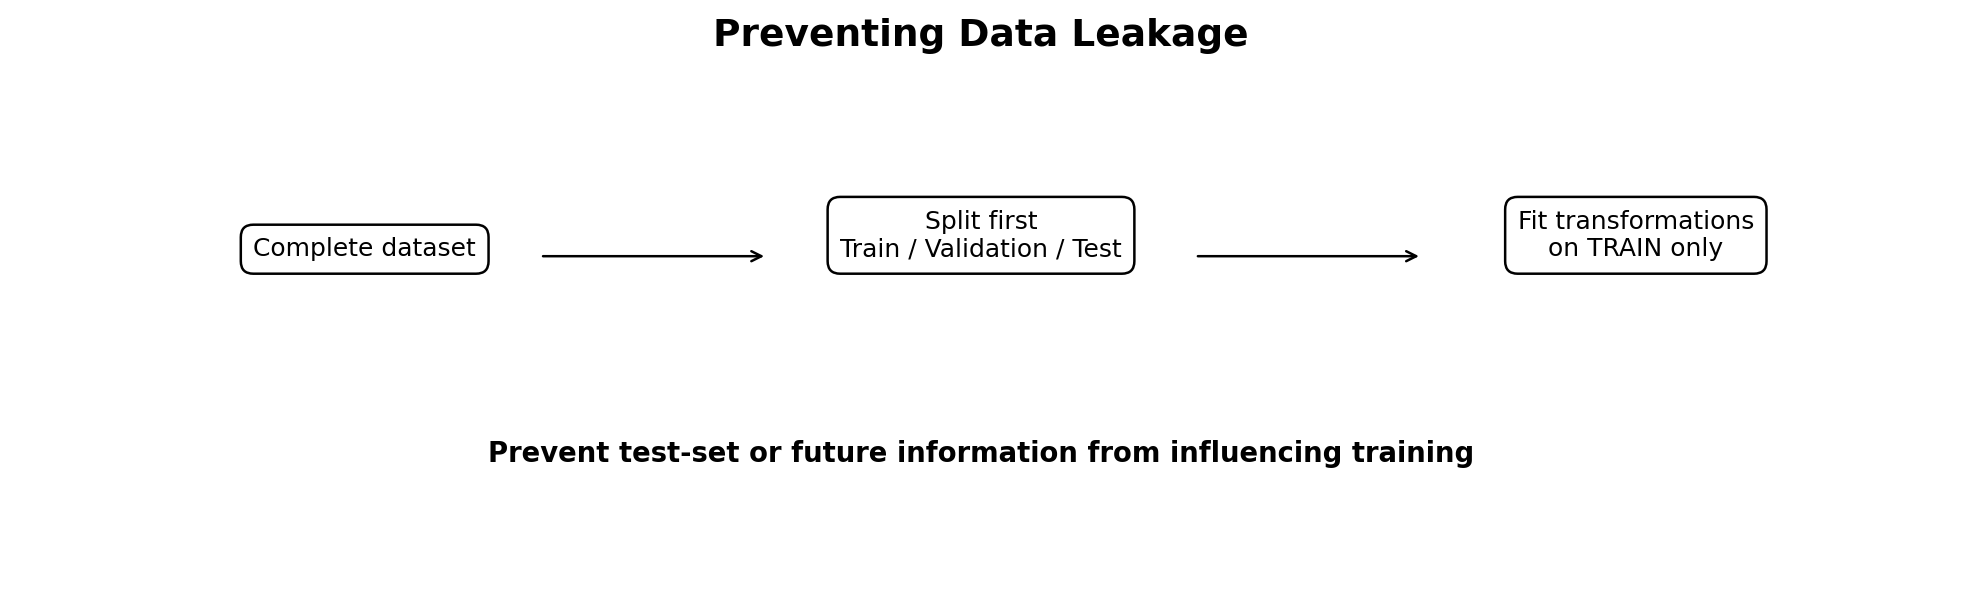
- Split train/validation/test before applying transformations that learn global statistics.
- Fit transformations only on the training set.
- Do not use a variable created after the event being predicted.
- For time series, preserve chronological order and never learn from the future.
1.14Preprocessing and Feature Engineering
Raw data is rarely ready for direct use. Preprocessing creates a consistent representation, while feature engineering creates or transforms variables to make useful information easier to learn.
- Handling missing values.
- Handling duplicates and anomalies.
- Encoding categorical variables.
- Normalization or standardization when scale affects learning.
- Creation of relevant new features.
- Removal of useless, redundant, or unavailable-at-production features.
1.15Imbalanced Data
A dataset is imbalanced when one class is much more common than another. In that situation, high overall accuracy can hide very poor performance on the minority class.
- Examine the class distribution.
- Use precision, recall, F1-score, and the confusion matrix.
- Preserve representative class proportions in splits when appropriate.
- Apply rebalancing techniques only to training data so the evaluation is not contaminated.
1.16Reproducibility of Experiments
A Machine Learning result should be reproducible. Reproducibility makes experiments comparable, helps explain performance differences, and makes it possible to return to earlier versions.
- Version the code and, when possible, the data.
- Record the hyperparameters of every experiment.
- Record metrics and evaluation conditions.
- Fix random seeds when appropriate.
- Document preparation steps and transformations.
1.17Deployment, Monitoring, and Drift
Real-world data changes over time. A system that performs well today may degrade later, so monitoring is needed to detect data drift, concept drift, and declining performance.
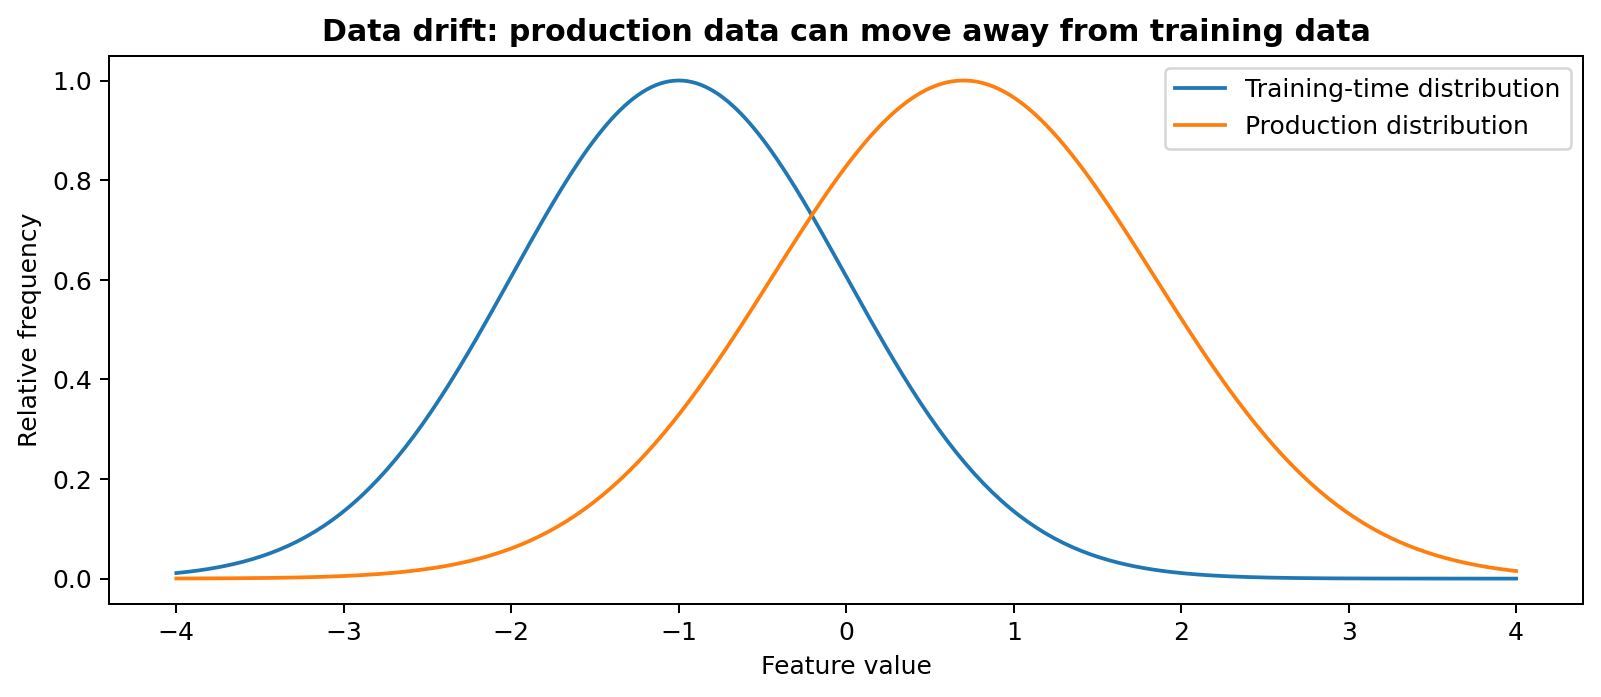
- Data drift: the distribution of input features changes.
- Concept drift: the relationship between inputs and the target changes.
- Monitoring: tracking performance, distributions, errors, and volumes.
- Retraining: updating the system with newer data when necessary.
1.18Fundamental Best Practices
- Understand the business/problem context before experimenting.
- Explore the data before transforming it.
- Build a simple baseline as a reference point.
- Clearly separate training, validation, and test.
- Avoid data leakage.
- Choose metrics according to the real cost of errors.
- Document experiments to ensure reproducibility.
- Analyze generalization rather than training performance alone.
- Monitor the system after deployment.
Conclusion: models come after these fundamentals. A sound methodology, reliable data, and honest evaluation are the foundations of a robust Machine Learning project.
1.19Data Quality in Practice
Data quality is multidimensional. A dataset can be large but still be unsuitable for learning if it is incomplete, inconsistent, poorly labeled, biased, or different from the environment in which the system will operate.
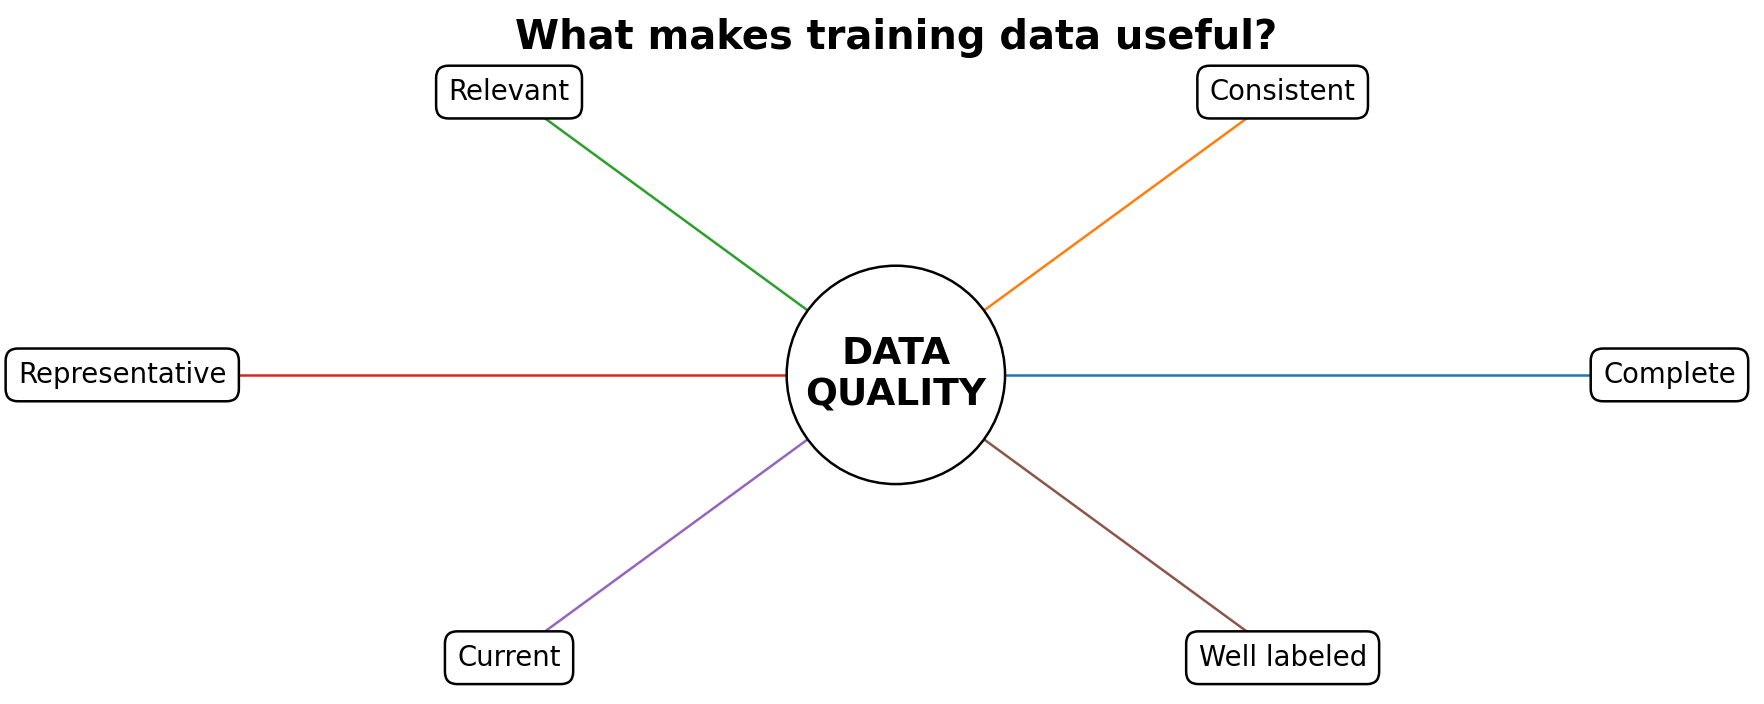
- Completeness: understand why values are missing instead of automatically filling them.
- Consistency: use stable units, formats, identifiers, and category definitions.
- Representativeness: make sure important populations and operating conditions are present.
- Label reliability: noisy labels limit what supervised learning can learn.
- Timeliness: data should reflect the environment where predictions will be made.
- Documentation: record where data came from, how it was collected, and what each field means.
1.20Cross-Validation
Cross-validation provides a more robust estimate of performance when a single train/validation split may be too dependent on chance. In k-fold cross-validation, the data is divided into k folds. The experiment is repeated k times, using a different fold for validation each time and averaging the results.
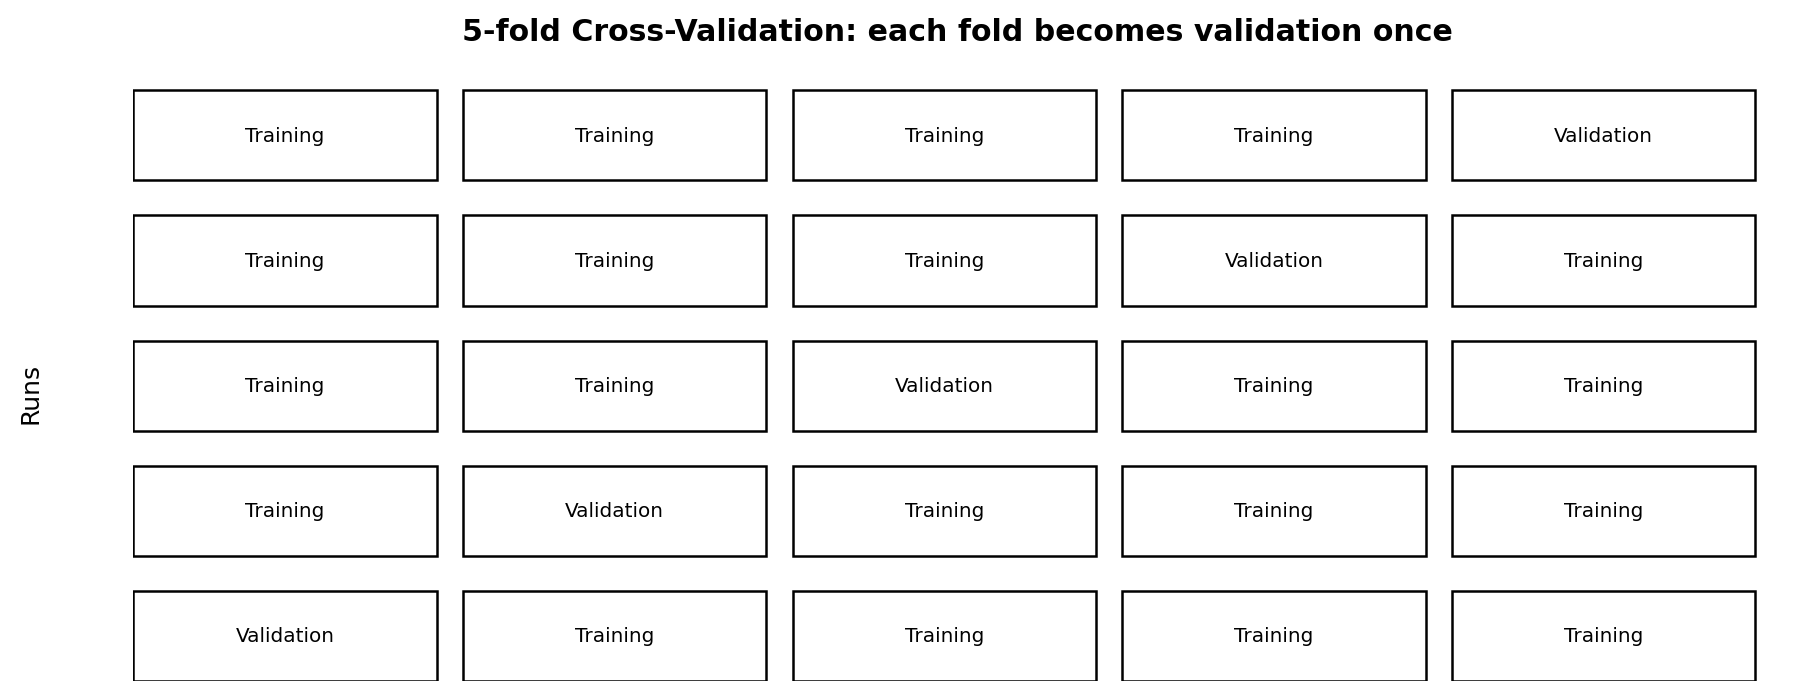
For time-series data, ordinary random k-fold splitting can be inappropriate because it may allow future information to influence the past. Temporal validation should preserve chronological order.
1.21Building a Safe Preprocessing Pipeline
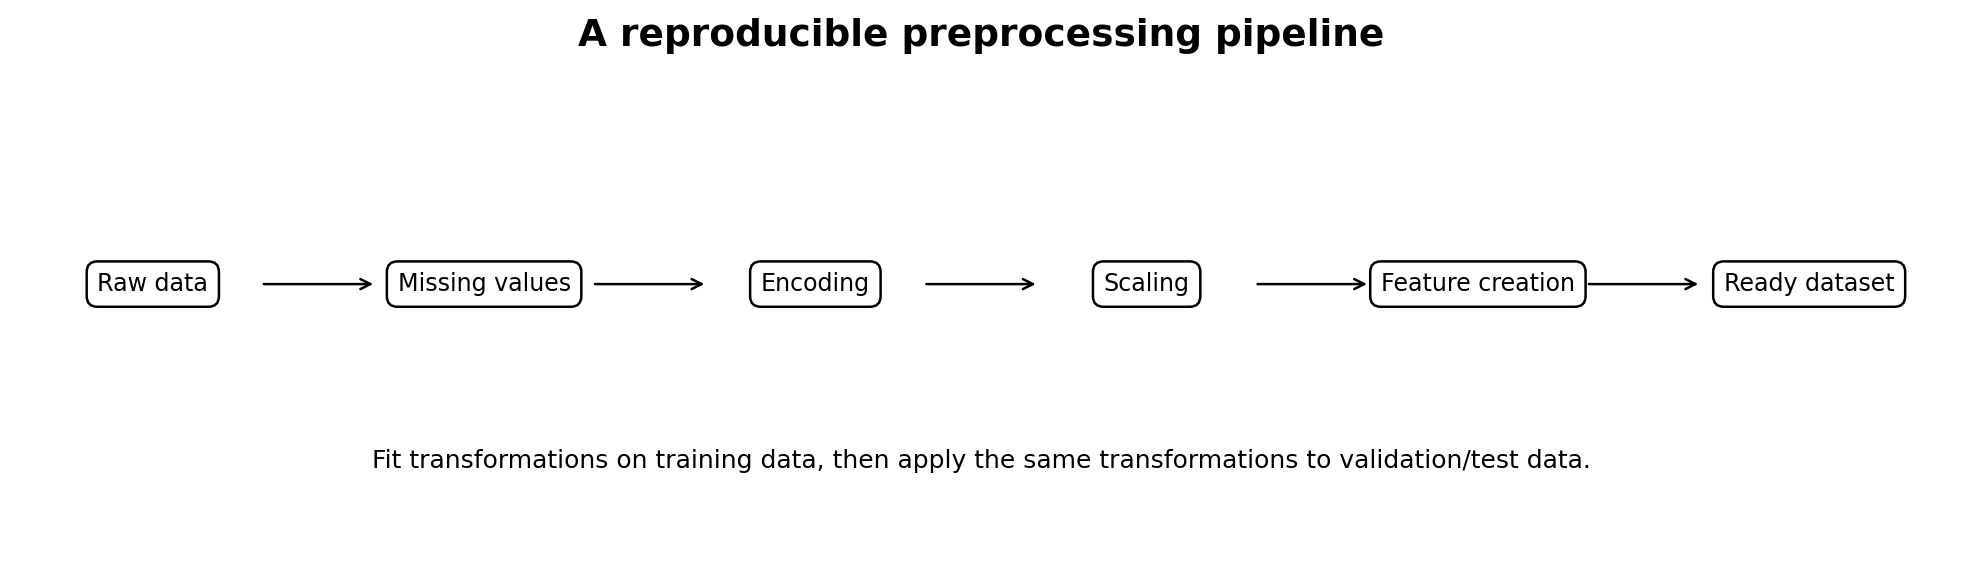
Preprocessing should be reproducible and should not learn information from validation or test data. Statistics such as means, standard deviations, category vocabularies, or imputation values should be learned from training data and then reused unchanged on later data.
- Separate the data before fitting learned transformations.
- Fit preprocessing steps on training data only.
- Apply the fitted transformations to validation, test, and production data.
- Keep preprocessing and prediction steps versioned together.
- Check that every feature will actually be available at prediction time.
1.22Understanding Class Imbalance
Class imbalance is common in fraud detection, fault detection, medical screening, and other rare-event problems. A system that always predicts the majority class can achieve high accuracy while being practically useless.
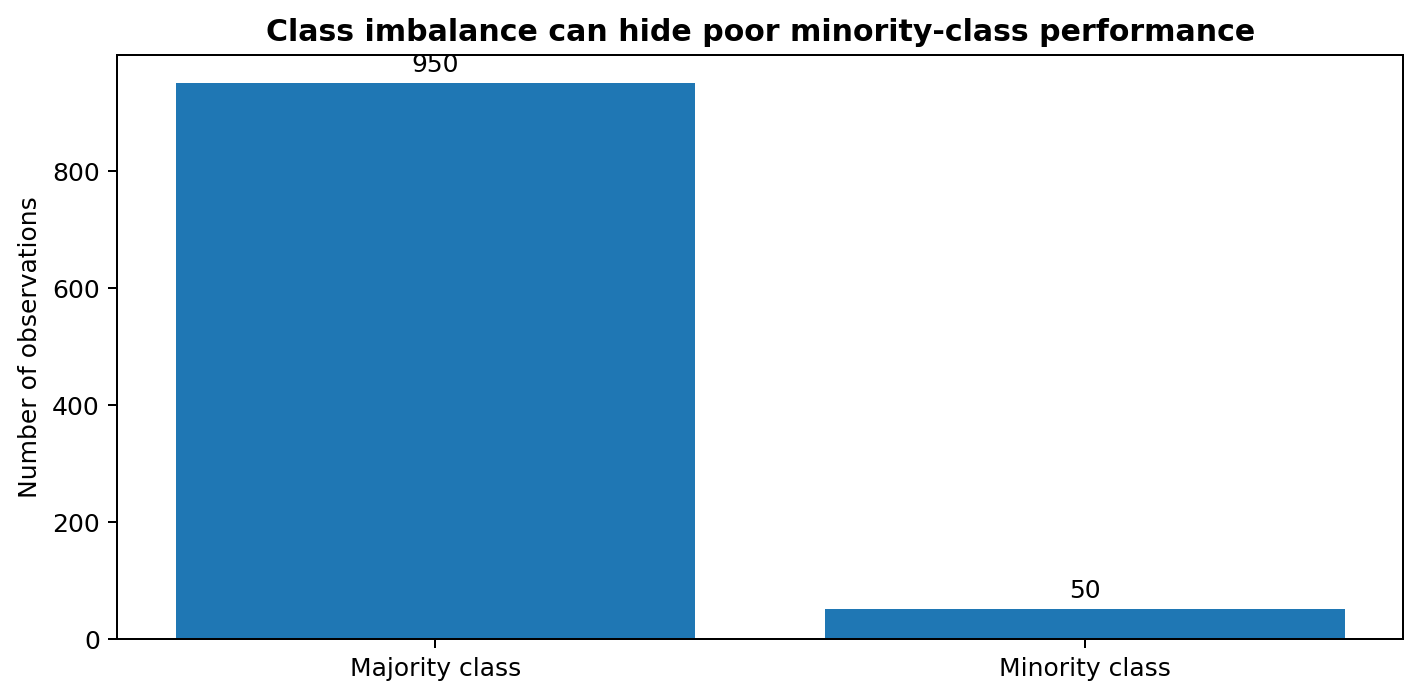
Evaluation should therefore examine minority-class recall, precision, F1-score, the confusion matrix, and the real cost of false positives and false negatives.
1.23Baselines and Experimental Discipline
A baseline is a simple reference result used to judge whether a more sophisticated learning system is actually adding value. Without a baseline, an apparently strong score may be difficult to interpret.
- Define a simple reference before extensive tuning.
- Change a limited number of factors at a time.
- Keep the same validation protocol when comparing experiments.
- Record metrics, hyperparameters, dataset version, and preprocessing version.
- Prefer improvements that remain stable across multiple validation runs.
1.24Monitoring and Data Drift
Deployment changes the problem from a static experiment into a living system. Input distributions, user behavior, business rules, sensors, and external conditions can change. Monitoring is used to detect when production data no longer resembles the training environment.
- Monitor input distributions and missing-value rates.
- Track prediction quality when ground-truth labels become available.
- Watch important subgroups separately rather than only global averages.
- Define thresholds for investigation, rollback, or retraining.
- Revalidate a retrained system before replacing the deployed version.
1.25Final Fundamentals Checklist
Before moving on to individual algorithms, verify you can confidently answer each item below:
- I can distinguish observations, features, targets, parameters, and hyperparameters.
- I understand supervised, unsupervised, and reinforcement learning at a conceptual level.
- I know why training, validation, and test data have different roles.
- I understand loss, optimization, generalization, underfitting, and overfitting.
- I can explain bias and variance conceptually.
- I know why evaluation metrics must reflect the real cost of errors.
- I understand data leakage and how preprocessing pipelines prevent it.
- I know why class imbalance changes how performance should be evaluated.
- I understand reproducibility, baselines, monitoring, and drift.